Days, Not Inches
Annual snowfall totals get the headlines, but a contractor does not get paid by the inch of season total. Labor, fuel, and wear are spent one event at a time. Twelve inches in one storm is one long night. Twelve inches across six storms is six call-outs.
NOAA's National Centers for Environmental Information (NCEI) publishes the 1991-2020 U.S. Climate Normals, the official 30 year baseline. Along with average snowfall, the normals include the average number of days per year and per month with snowfall of at least 0.1, 1, 3, and 5 inches. Those day counts are the closest thing to a planning number for how often you will be plowing.
Nine Cities, Side by Side
Here is what the 1991-2020 normals show at nine stations (NOAA NCEI, 1991-2020 Climate Normals). For each city: average annual snowfall, then average days per year with at least 1 inch, then days with at least 3 inches, then days with at least 5 inches.
Salt Lake City, UT: 51.9 inches. 16.1 days at 1 inch or more, 5.4 days at 3 inches or more, 2.1 days at 5 inches or more.
Denver, CO: 49.0 inches. 15.9 days, 4.7 days, 1.7 days.
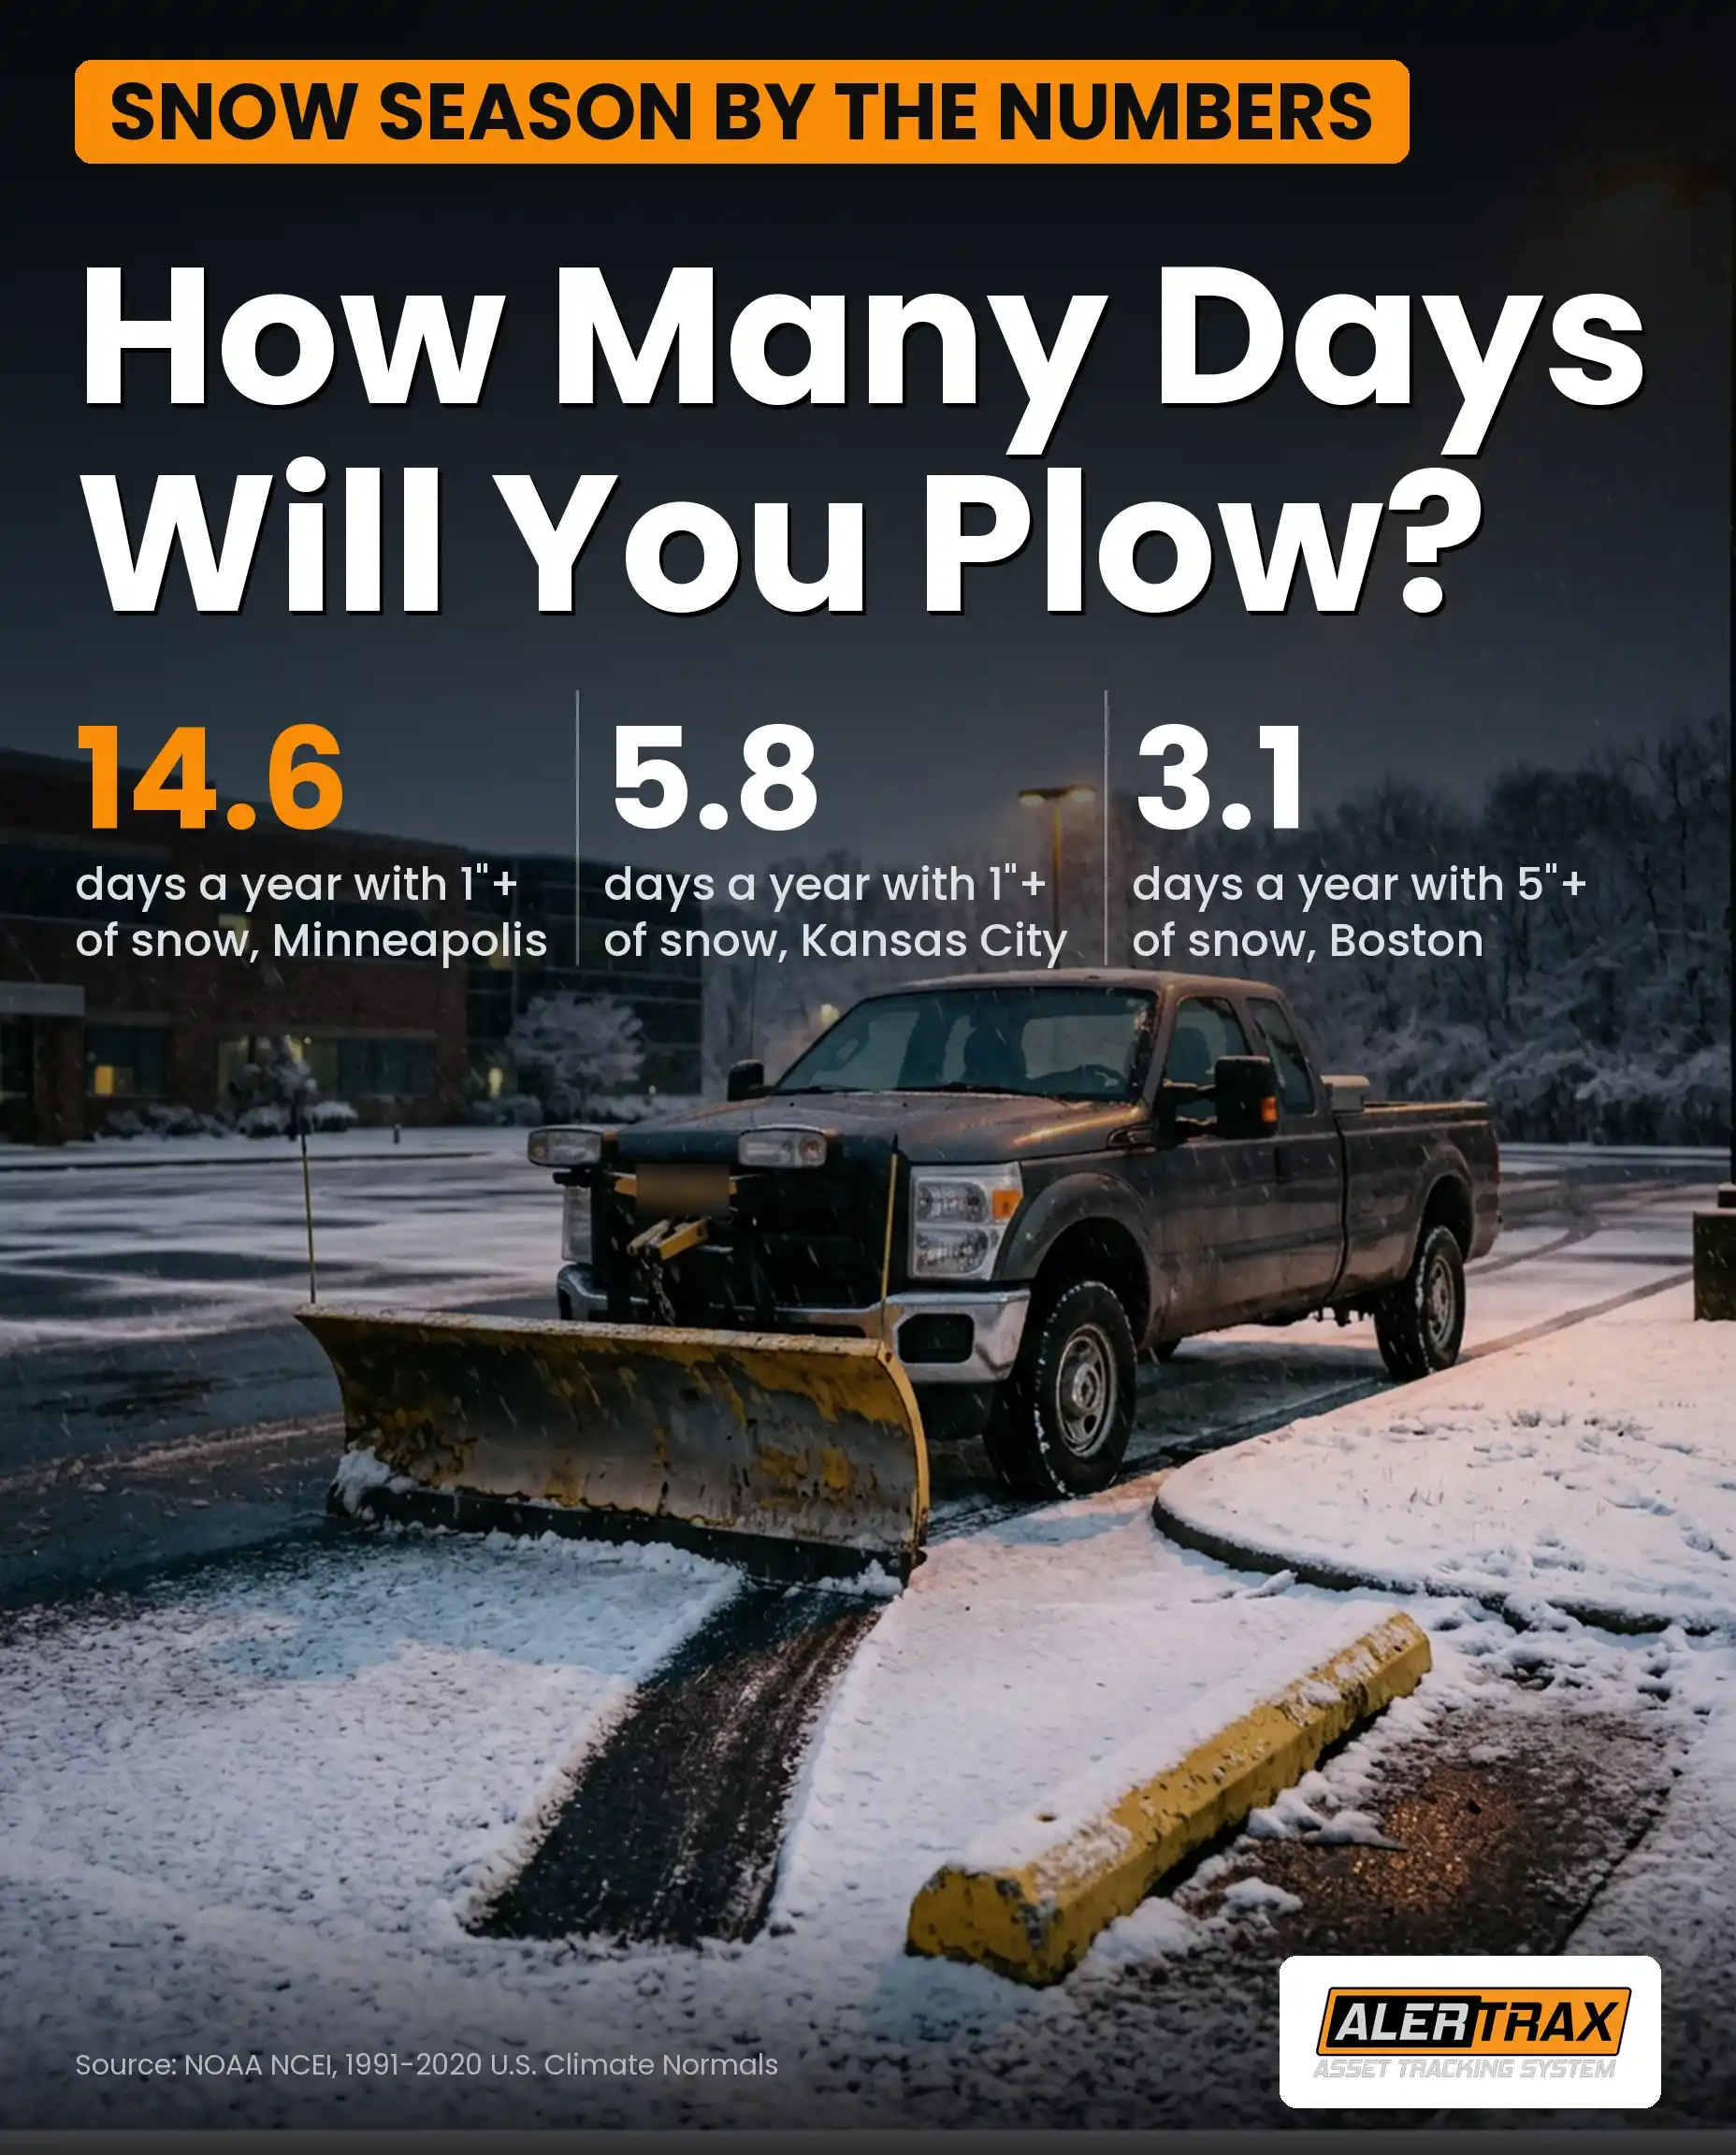
Minneapolis-St. Paul, MN: 51.2 inches. 14.6 days, 5.0 days, 2.1 days.
Detroit, MI: 45.0 inches. 13.6 days, 4.3 days, 1.7 days.
Chicago, IL (O'Hare): 38.4 inches. 11.4 days, 3.9 days, 1.4 days.
Boston, MA: 49.2 inches. 11.1 days, 5.0 days, 3.1 days.
Columbus, OH: 28.2 inches. 8.8 days, 2.2 days, 0.6 days.
Indianapolis, IN: 25.5 inches. 7.6 days, 2.2 days, 1.0 days.
Kansas City, MO: 18.2 inches. 5.8 days, 1.4 days, 0.7 days.
The Denver figures come from the Denver-Stapleton station, because NOAA's normals for Denver International Airport do not include snowfall. The rest are the main airport stations.
Same Snow, Different Winter
Boston and Minneapolis get about the same amount of snow in an average year: 49.2 inches and 51.2 inches. They are very different businesses.
Minneapolis averages 14.6 days with an inch or more. Boston averages 11.1. But Boston averages 3.1 days a year with 5 inches or more, compared with 2.1 in Minneapolis (NOAA NCEI, 1991-2020 Climate Normals). Boston's snow tends to come in fewer, bigger storms.
That changes the operation. A city of frequent moderate events rewards steady, repeatable routes and drivers who can go out three nights a week. A city of fewer big storms rewards surge capacity: extra equipment staged at the right lots, a deep standby list, and the ability to run for a long stretch when it hits.
When the Season Actually Starts
The monthly normals show when the plowable days arrive. Average days with at least 1 inch of snow, for November and then December (NOAA NCEI, 1991-2020 Climate Normals):
Denver: 2.5 in November, 2.3 in December, and 1.2 in October.
Salt Lake City: 2.1 in November, 3.8 in December.
Minneapolis-St. Paul: 1.9 in November, 3.3 in December.
Detroit: 0.6 in November, 2.7 in December.
Chicago: 0.5 in November, 2.2 in December.
Boston: 0.2 in November, 1.9 in December.
Denver is the outlier in both directions. Its snow season starts in October, and it still averages 2.1 days with an inch or more in April. In Denver, the season is roughly seven months long. In Boston, most of the plowable days fall between December and March.
For most of the Midwest and Northeast, that means the roster has to be ready by Thanksgiving week, and fully staffed by December.
What the Days Do to Your Numbers
Here is an example, not survey data. Two contractors each sell a seasonal contract on a lot, at the same price.
One is in Kansas City, with 5.8 average plowable days. One is in Salt Lake City, with 16.1. If each event costs the same in labor, fuel, and wear, the Salt Lake City contractor will spend almost three times as much servicing that contract in an average year.
Standby works the same way. If your drivers are paid to wait when a storm is coming, the number of storm days drives that cost too. Federal rules on when waiting time counts as work are covered in Paid to Wait? Snow Crews on Standby. If any of your plow trucks are commercial motor vehicles, every seasonal driver needs a qualification file before the first event; see Your Snow Drivers Need a File Before They Need a Plow.
And remember what a normal is: an average across 30 winters. Any single season can come in at half the normal or double it. That is the case for pricing and staffing against the average, and for knowing exactly what each event actually cost you, so you can tell which kind of winter you are having.
How to Use This Before the Roster Meeting
1. Look up your own station. Find the station nearest your service area in NOAA's 1991-2020 normals and note the average days per year with at least 1, 3, and 5 inches of snow. Write them on the whiteboard.
2. Match the days to your contract triggers. If your contracts trigger at a specific depth, the day count at or above that depth is your expected number of call-outs. The 3 inch and 5 inch counts are much smaller than the 1 inch count in every city above.
3. Cost one event. Trucks, drivers, hours, fuel, salt. Multiply by the expected days. Compare that with what your seasonal contracts actually bring in.
4. Plan for the big days separately. In a 5 inch city like Boston, the question is surge capacity: who and what can you add for a long night?
5. Track what actually happens. At the end of the season, compare your real number of call-outs and hours per event with the normal. That is how you price next year.
Where Alertrax Fits
Step 5 is the hard one. Knowing exactly when each truck went out, which lots it visited, and how long it spent there is what turns a gut-feel season into a real cost per event. Alertrax records that automatically.
- Automatic Time-on-Site Logging: Every arrival and departure at every lot is timestamped, which doubles as proof of service when a property manager asks if you were there.
- Trip Reports You Can Export: Pull a storm's worth of trips by truck or across the fleet, with start time, stop time, addresses visited, duration, and distance.
- Live Fleet Map: See every tracked plow truck, trailer, and staged skid steer on one map in the Alertrax Fleet Portal, with location updates every 2 minutes.
- After-Hours Movement Alerts: Equipment staged at a customer's lot all winter is exposed. Get an alert if it moves when it should not.
- One-Year Battery, No Wiring Required: Alertrax runs on two AA cells, so it goes on a skid steer or a trailer with nothing to wire in and nothing to charge.
- 100% Waterproof, Covert Magnetic Mounting: Mounts to a steel frame in seconds and keeps working through slush, salt, and cold.
- iOS and Android App: Check the map and the night's history from your phone at 3 AM.
Pricing
You can equip your fleet with Alertrax for a low monthly rate, no long-term contracts, no hidden fees.
(Want to own it outright? We offer a $599 Lifetime option for permanent, subscription-free tracking.)
Sources
NOAA National Centers for Environmental Information (NCEI), 1991-2020 U.S. Climate Normals, annual/seasonal and monthly normals for snowfall (ANN-SNOW-NORMAL) and average number of days with snowfall of at least 1.0, 3.0, and 5.0 inches (ANN-SNOW-AVGNDS-GE010TI, GE030TI, GE050TI; MLY-SNOW-AVGNDS-GE010TI), retrieved October 2026 for stations Salt Lake City International Airport (USW00024127), Denver-Stapleton (USW00023062), Minneapolis-St. Paul International Airport (USW00014922), Detroit Metro Airport (USW00094847), Chicago O'Hare International Airport (USW00094846), Boston Logan International Airport (USW00014739), Port Columbus International Airport (USW00014821), Indianapolis International Airport (USW00093819), and Kansas City International Airport (USW00003947). The Denver International Airport normals (USW00003017) do not include snowfall
This article is provided for general informational purposes and is not financial, legal, or forecasting advice. Climate normals are 30 year averages and do not predict any particular winter; actual snowfall in a given season can be far above or below normal, and conditions at your service area may differ from the nearest airport station. The contract comparison above is an illustration, not survey data.
Plan for the Days You Will Actually Work
Inches make the news. Days make the payroll. Know your number before the roster meeting, and measure the real one as the winter goes.
Visit www.buyalertrax.com today and see every plow, trailer, and staged machine on one map this winter.