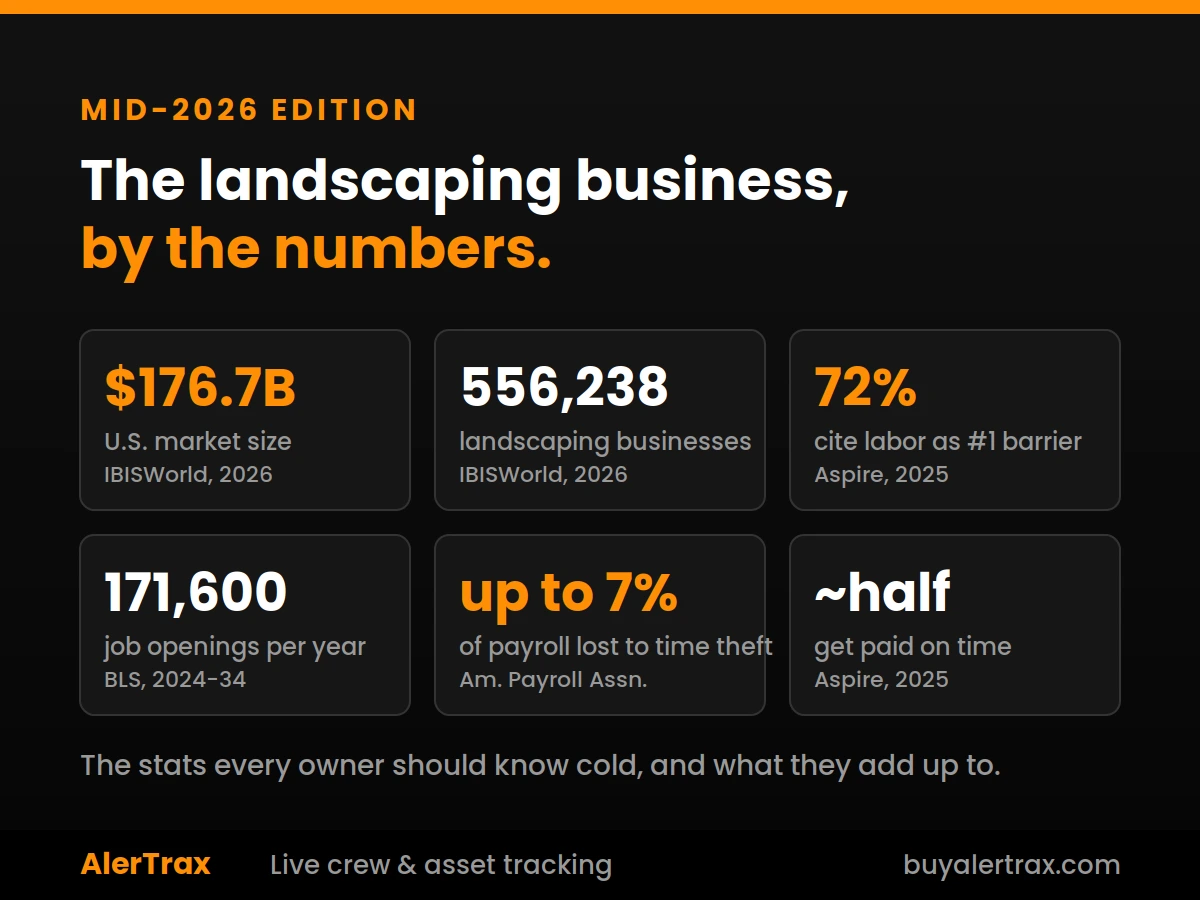
Halfway through 2026 is a good time to look up from the schedule and check the numbers, not your numbers for once, but the industry's. The stats below are the current state of the landscaping business in the United States, pulled from government data, industry associations, and independent research, all published or updated within the last year or so.
Some of these will confirm what you feel every day. A few might surprise you. Together they tell one clear story about where the money in this industry is made and lost right now, and we will get to that story at the end. First, the numbers.
The Market
- $176.7 billion. The size of the U.S. landscaping services industry through 2026, after growing at a 3.0 percent annual rate since 2021 (IBISWorld).
- 556,238 businesses. The number of landscaping companies operating in the U.S. in 2026, up 1.8 percent from last year (IBISWorld).
- No dominant player. The industry has low market share concentration: even the largest company holds only a small fraction of the market (IBISWorld). Translation: this is still a business where a well-run local operator can win.
- Mild to moderate growth is the 2026 forecast, with significant variation between individual markets (NALP / ITR Economics, January 2026 Economic Forecast).
Do the division on the first two numbers and you get the most underrated stat in the industry: an average of roughly $318,000 in revenue per business, spread across half a million companies. The market is enormous, but it is won in small increments, one route, one contract, one crew-hour at a time.
The Customer Economics
- 355 customers. The median customer count among companies in NALP's most recent Financial Benchmark Study (NALP, 2025 Financial Benchmark Study).
- $14,682 per customer. The revenue the median participant generated per customer (NALP, 2025 Financial Benchmark Study).
- 8.5 percent. Typical reported sales growth, while the most profitable companies grew a more deliberate 7.2 percent (NALP, 2025 Financial Benchmark Study).
Sit with that last pair for a second. The most profitable companies grew slower than the typical company. Growth and profit are not the same project, and the owners winning on margin are the ones choosing their work instead of taking all of it.
The Labor Math
- 1,296,400 jobs. U.S. employment in grounds maintenance work as of 2024 (U.S. Bureau of Labor Statistics, Occupational Outlook Handbook).
- $18.50 per hour. The median wage for grounds maintenance workers, $38,470 a year (BLS, May 2024). Remember that is the median: in competitive metros, experienced crew members cost well more.
- 171,600 openings a year. Projected annual openings in the occupation through 2034, most of them replacing workers who leave (BLS). The hiring treadmill is structural, not seasonal.
- 30 to 50 percent of revenue. What labor consumes at a typical landscaping company, making it the largest single expense in the business (Aspire, 2025 Commercial Landscape Industry Report).
- 72 percent. The share of owners who name labor as their number one barrier to growth (Aspire, 2025).
- Roughly 70 percent. The share of companies planning wage increases just to hold onto the crews they have (Aspire, 2025).
- 75 percent of companies experience some form of time theft, which can cost up to 7 percent of total payroll (American Payroll Association). On a $400,000 payroll, the top of that range is $28,000 a year.
Read those seven numbers as one paragraph: your biggest cost is scarce, getting more expensive on purpose, structurally hard to replace, and leaking a measurable slice of itself through hours that were paid but not worked. Every other number in this post lives downstream of that one.
The Billing Gap
- 76 percent of landscaping contractors send their invoice within four days of finishing the job (Aspire, 2025).
- Only about half report actually getting paid on time (Aspire, 2025).
The industry does not have an invoicing problem. It has a collection problem, and a meaningful share of it runs through disputes and doubts: when did the crew arrive, how long were they there, did the visit happen at all. An invoice a customer can question is an invoice that ages.
The Safety Numbers
- Heat leads. The National Weather Service ranks heat as the top cause of weather-related deaths in the United States (National Weather Service).
- 48 workers were killed by on-the-job heat exposure in 2024, with thousands more injured seriously enough to miss work, and government analysts consider both figures undercounts (U.S. Bureau of Labor Statistics, via the National Safety Council).
- Landscaping is named. OSHA's revised National Emphasis Program for heat hazards, in effect since April 2026 and running through 2031, lists landscaping among its high-risk target industries (OSHA).
The season that makes your revenue is also the season that puts your people at the most risk, and the regulators are now watching the same weeks you are.
The Story the Numbers Tell
Line them up and the through-line is hard to miss. The market is huge but fragmented, so nobody hands you share; you take it operationally. Your largest cost is labor, and every force in the data, scarcity, wage pressure, turnover, time theft, is pushing that cost up while your ability to simply hire more of it stays jammed. Half the industry struggles to turn finished work into on-time cash. And the same summer weeks that generate the revenue concentrate the safety risk.
Every one of those pressures rewards the same unglamorous capability: measurement. Knowing where crews actually are, how long jobs actually take, which routes actually make sense, and being able to prove all of it, to a customer disputing an invoice, to yourself repricing a contract, or to anyone asking whether your people are accounted for on a 95-degree day. The owners pulling ahead in a fragmented market are not the ones with the most trucks. They are the ones whose numbers are real.
Where AlerTrax Fits
That measurement layer is exactly what AlerTrax was built to be, without the enterprise software project:
- Over a Year of Battery Life, No Wiring: Runs on its own battery. No splicing, no OBD port, no install appointment. Mount it and it works, on trucks, trailers, mowers, and skid steers alike.
- Live Fleet Map: Every asset in the AlerTrax Fleet Portal and the iOS and Android app, updated as often as every 2 minutes.
- Automatic Time-on-Site Logging: Arrival and departure timestamps at every stop, the raw data behind accurate job costing, defensible invoices, and honest payroll.
- AddressFence and Geofence Alerts: Notifications the moment an asset arrives at or leaves any address or boundary you define.
- Route History: Every day's actual routes, mapped, so the drive-time waste has nowhere to hide.
- 100% Waterproof, Ruggedized, Covert Mount: Built for equipment that works outside and gets pressure-washed for a living.
The Pricing Number
One more stat for the collection: you can put AlerTrax on your entire fleet for a low monthly rate, with no long-term contracts and no hidden fees. Hold that against the labor numbers above, a $28,000 annual leak at the top of the APA's time-theft range on a $400,000 payroll, and the tracker is not a cost line. It is the cheapest line of defense on the sheet.
(Want to own it outright? There is a $599 one-time Lifetime option for permanent, subscription-free tracking. No fees, ever.)
See the monthly plan and get set up here.
And One Number About Theft
Since every stat post about this industry eventually gets asked: yes, the same trackers watch your equipment. Geofence the yard and AlerTrax alerts you within minutes if a truck, trailer, or mower moves after hours, with tamper notifications on the device itself. It is not the reason to buy, the labor math above is, but it is a nice number to have at 2 AM: minutes to know, instead of hours.
Know Your Numbers, Then Fix Them
The industry data can tell you where the pressure is. Only your own data can tell you where you are losing to it. The second half of 2026 belongs to the owners who can see the difference.
Visit www.buyalertrax.com and start turning the numbers on this page into numbers about your own fleet.
Sources
IBISWorld, Landscaping Services in the US (2026): Industry revenue of $176.7 billion through 2026 at a 3.0% CAGR since 2021; 556,238 businesses, up 1.8% from 2025; low market share concentration.
NALP / ITR Economics, January 2026 Economic Forecast Report: 2026 projected as a year of mild to moderate growth with significant deviation between markets.
NALP, 2025 Financial Benchmark Study: Median of 355 customers and $14,682 in revenue per customer; typical sales growth of 8.5%; most profitable companies grew 7.2%.
U.S. Bureau of Labor Statistics, Occupational Outlook Handbook (Grounds Maintenance Workers): 1,296,400 jobs in 2024; median pay of $18.50 per hour ($38,470 per year, May 2024); 4% projected growth from 2024 to 2034; about 171,600 openings projected each year.
Aspire, 2025 Commercial Landscape Industry Report: Labor consumes 30 to 50% of revenue; 72% of owners cite labor as their top growth barrier; roughly 70% plan wage increases; 76% bill within four days while only about half report on-time payment.
American Payroll Association: 75% of companies experience some form of time theft, costing up to 7% of total payroll.
National Weather Service: Heat is among the leading causes of weather-related deaths in the U.S.
U.S. Bureau of Labor Statistics, via the National Safety Council: 48 work-related deaths from environmental heat exposure in 2024, widely regarded as an undercount.
OSHA: Revised National Emphasis Program for Outdoor and Indoor Heat-Related Hazards (effective April 2026, through 2031), naming landscaping among high-risk target industries.